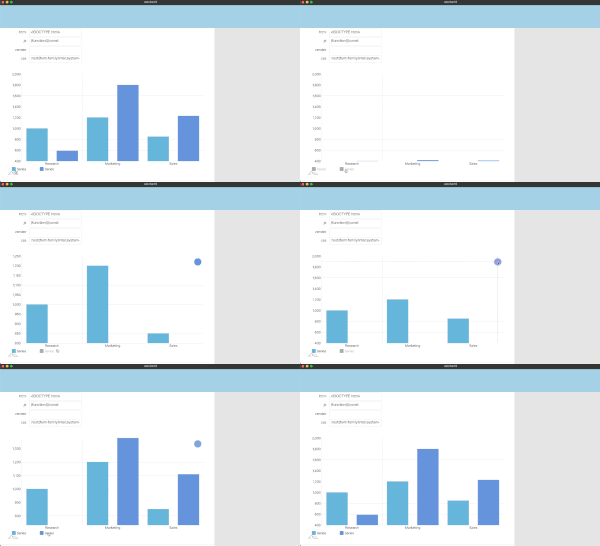
ここ数年、体重は右肩上がりのジョージです。今回は amCharts 勉強しましょう。

amCharts とは
amCharts 5 is the newest go-to library for data visualization. When you don’t have time to learn new technologies. When you need a simple yet powerful and flexible drop-in data visualization solution, backed with detailed docs and seriously efficient support.
amCharts は最新の頼りになる視覚化ツールとのことです。それにしても「go-to」が「頼りになる」とは初めて聞いた英語の表現でした。
https://www.amcharts.com/javascript-charts/
You can download and use all amCharts 5 products for free. The only limitation of the free version is that a small amCharts logo will be displayed in the corner of your charts.
そして amCharts はチャートの隅に小さな amCharts ロゴを表示することで無料版として利用可能のようです。
https://www.amcharts.com/download/
プロジェクトの作成
前回までに Vite を使った Vue.js のプロジェクトをカスタム App に移植しているので、今回も同じように Vite を使って amChartsを実装します。以下の公式チュートリアルを参考にしました。
https://www.amcharts.com/docs/v5/getting-started/integrations/vue/
今回は対話形式で Vite プロジェクトを作成しました。
npm create vite@latest
プロジェクト名は「chart」とします。

フレームワークは「Vue」を選択しました。

バリアントは「JavaScript」を選択しました。

プロジェクトが作成されました。

パッケージをインストールします。
cd chart
npm install
amCharts をインストールします。
npm install @amcharts/amcharts5

開発用サーバを起動させます。
npm run dev
背景が暗いとサンプルが見づらいので sytle.css の 8 行目を「background-color: #FFFFFF」に変更します。また、37 行目の「display: flex;」はamCharts のサンプルがうまく表示されないのでコメントアウトしておきます。
style.css
:root {
  font-family: Inter, system-ui, Avenir, Helvetica, Arial, sans-serif;
  line-height: 1.5;
  font-weight: 400;

  color-scheme: light dark;
  color: rgba(255, 255, 255, 0.87);
  background-color: #FFFFFF;

  font-synthesis: none;
  text-rendering: optimizeLegibility;
  -webkit-font-smoothing: antialiased;
  -moz-osx-font-smoothing: grayscale;
  -webkit-text-size-adjust: 100%;
}

a {
  font-weight: 500;
  color: #646cff;
  text-decoration: inherit;
}
a:hover {
  color: #535bf2;
}

a {
  font-weight: 500;
  color: #646cff;
  text-decoration: inherit;
}
a:hover {
  color: #535bf2;
}

body {
  margin: 0;
  /* display: flex; */
  place-items: center;
  min-width: 320px;
  min-height: 100vh;
}

h1 {
  font-size: 3.2em;
  line-height: 1.1;
}

button {
  border-radius: 8px;
  border: 1px solid transparent;
  padding: 0.6em 1.2em;
  font-size: 1em;
  font-weight: 500;
  font-family: inherit;
  background-color: #1a1a1a;
  cursor: pointer;
  transition: border-color 0.25s;
}
button:hover {
  border-color: #646cff;
}
button:focus,
button:focus-visible {
  outline: 4px auto -webkit-focus-ring-color;
}

.card {
  padding: 2em;
}

#app {
  max-width: 1280px;
  margin: 0 auto;
  padding: 2rem;
  text-align: center;
}

@media (prefers-color-scheme: light) {
  :root {
    color: #213547;
    background-color: #ffffff;
  }
  a:hover {
    color: #747bff;
  }
  button {
    background-color: #f9f9f9;
  }
}

App.vue を チュートリアルの内容に変更します。
App.vue
<template>
  <div class="hello" ref="chartdiv">
  </div>
</template>

<script>
import * as am5 from '@amcharts/amcharts5';
import * as am5xy from '@amcharts/amcharts5/xy';
import am5themes_Animated from '@amcharts/amcharts5/themes/Animated';


export default {
  name: 'HelloWorld',
  mounted() {
    let root = am5.Root.new(this.$refs.chartdiv);

    root.setThemes([am5themes_Animated.new(root)]);

    let chart = root.container.children.push(
      am5xy.XYChart.new(root, {
        panY: false,
        layout: root.verticalLayout
      })
    );

    // Define data
    let data = [{
        category: "Research",
        value1: 1000,
        value2: 588
      },
 {
        category: "Marketing",
        value1: 1200,
        value2: 1800
      }, {
        category: "Sales",
        value1: 850,
        value2: 1230
      }
    ];

    // Create Y-axis
    let yAxis = chart.yAxes.push(
      am5xy.ValueAxis.new(root, {
        renderer: am5xy.AxisRendererY.new(root, {})
      })
    );

    // Create X-Axis
    let xAxis = chart.xAxes.push(
      am5xy.CategoryAxis.new(root, {
        renderer: am5xy.AxisRendererX.new(root, {}),
        categoryField: "category"
      })
    );
    xAxis.data.setAll(data);

    // Create series
    let series1 = chart.series.push(
      am5xy.ColumnSeries.new(root, {
        name: "Series",
        xAxis: xAxis,
        yAxis: yAxis,
        valueYField: "value1",
        categoryXField: "category"
      })
    );
    series1.data.setAll(data);

    let series2 = chart.series.push(
      am5xy.ColumnSeries.new(root, {
        name: "Series",
        xAxis: xAxis,
        yAxis: yAxis,
        valueYField: "value2",
        categoryXField: "category"
      })
    );
    series2.data.setAll(data);

    // Add legend
    let legend = chart.children.push(am5.Legend.new(root, {}));
    legend.data.setAll(chart.series.values);

    // Add cursor
    chart.set("cursor", am5xy.XYCursor.new(root, {}));

    this.root = root;
  },

  beforeDestroy() {
    if (this.root) {
      this.root.dispose();
    }
  }
}
</script>

<!-- Add "scoped" attribute to limit CSS to this component only -->
<style scoped>
.hello {
  width: 100%;
  height: 500px;
}
</style>
修正が反映されると、ブラウザでグラフが表示されます。

次回は amCharts をカスタム App と連携させてグラフを表示してみます!お楽しみに。


